Eskom Tariff Increases: How Solar Protects Your Business from Rising Electricity Costs
Published: March 2026 | Category: Energy Economics
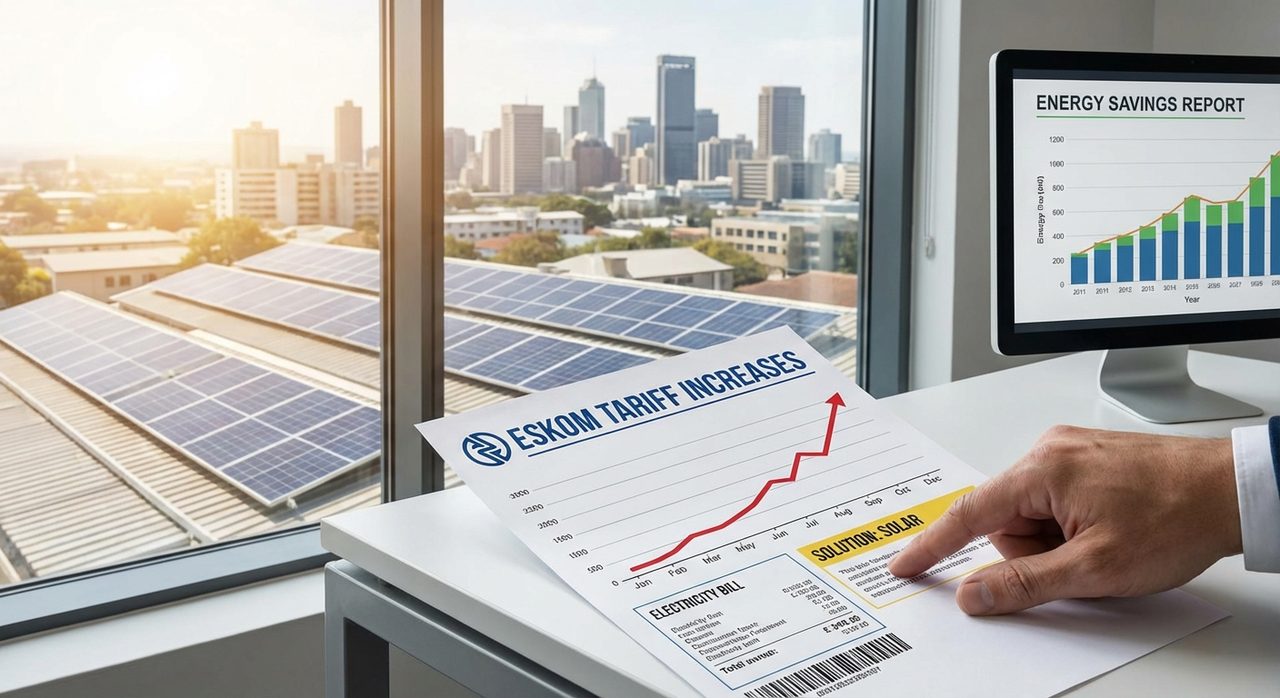
In 2008, the average South African business paid approximately R0.23 per kilowatt-hour for electricity. By 2026, that figure has risen to R2.20–R2.80 per kWh for most commercial consumers — a compound increase of over 850% in 18 years.
No other major input cost in South African business has escalated at remotely this pace. Fuel has increased roughly 4-fold over the same period. The JSE has grown approximately 3-fold in rand terms. Eskom electricity has increased more than 8-fold.
Understanding this trajectory — and how solar permanently changes your exposure to it — is fundamental to the investment case for commercial solar in South Africa.
The Full History of Eskom Tariff Increases (2008–2026)
The electricity price crisis in South Africa began after years of artificially suppressed tariffs in the early 2000s. Eskom had priced electricity below the cost of production to support industrial growth — a policy that became financially unsustainable when the first load shedding crisis hit in 2008.
NERSA subsequently approved a series of large annual increases as Eskom attempted to reach "cost-reflective tariffs":
| Financial Year | Approved Increase | Cumulative (from 2008 base) |
|---|---|---|
| 2009/10 | 31.3% | +31% |
| 2010/11 | 24.8% | +63% |
| 2011/12 | 25.8% | +106% |
| 2012/13 | 16.0% | +139% |
| 2013/14 | 8.0% | +158% |
| 2014/15 | 8.0% | +179% |
| 2015/16 | 12.7% | +214% |
| 2016/17 | 9.4% | +243% |
| 2017/18 | 2.2% | +251% |
| 2018/19 | 5.23% | +270% |
| 2019/20 | 13.87% | +322% |
| 2020/21 | 8.1% | +356% |
| 2021/22 | 15.06% | +424% |
| 2022/23 | 18.65% | +521% |
| 2023/24 | 12.74% | +600% |
| 2024/25 | 12.74% | ~690% |
| 2025/26 | ~8-12% (est.) | ~750-770% |
The bottom line: a business spending R100,000 per year on electricity in 2008 would spend R850,000 per year for the same consumption in 2026. An 8.5-fold increase.
Why Eskom Tariffs Will Keep Rising
Eskom's financial position makes continued above-inflation tariff increases virtually inevitable for the foreseeable future. The key structural drivers are:
Debt Load
Eskom carries roughly R400 billion in debt (R250 billion was transferred to government under a debt relief arrangement, with conditions). Even after debt relief, Eskom's remaining operational debt and capital requirements mean it cannot generate adequate cash flow at current tariff levels without ongoing government support.
New Generation Capacity Cost
South Africa needs approximately 5,000MW of new capacity in the short term and over 30,000MW over the next decade to meet projected demand and retire ageing coal plants. Whether this is procured through Eskom, IPPs (Independent Power Producers), or a combination, the capital cost will be recovered through future tariffs.
Operation and Maintenance of Ageing Fleet
Eskom's coal fleet, with an average station age of 35+ years, requires ever-increasing maintenance expenditure to sustain energy availability. As plants are retired, generation costs from remaining plants increase. Medupi and Kusile — the new coal plants — were built at dramatically higher cost than the fleet average, increasing the per-unit generation cost even before factoring in interest.
NERSA's MYPD Process
Eskom's Multi-Year Price Determination (MYPD) applications to NERSA set out the revenue required over a regulatory period. Eskom's filings consistently request above-CPI increases. While NERSA has historically approved less than requested, the approved increases have still consistently exceeded headline CPI.
What This Means for Your Business's Energy Budget
Most South African businesses budget for electricity as a fixed or slightly increasing cost line item. This is a fundamental planning error.
Consider a medium-sized manufacturing business currently spending R500,000 per year on electricity:
- At 10% annual tariff increase: R500,000 → R1,297,000 by year 10 → R3,364,000 by year 20
- At 12% annual tariff increase: R500,000 → R1,552,000 by year 10 → R4,823,000 by year 20
- At 8% annual tariff increase: R500,000 → R1,079,000 by year 10 → R2,330,000 by year 20
Over 20 years, at 10% annual escalation, this business will spend R8.5 million on electricity — before the business grows at all. That is R8.5 million that leaves the business and funds Eskom. Or it is R8.5 million that could be partially retained through solar generation.
How Solar Acts as an Electricity Price Hedge
A solar system generates electricity at a fixed effective cost per kWh. Once installed, the capital cost is sunk. The ongoing cost (O&M, monitoring, occasional repairs) is typically R0.03–R0.10/kWh over the system life, effectively negligible.
The effective levelised cost of energy (LCOE) from a well-designed commercial solar system in South Africa today is R0.60–R0.90/kWh over 25 years, compared to the current Eskom commercial tariff of R2.00–R2.80/kWh.
But the hedge value is not just the difference today — it is the compounding difference over time:
- Year 1: Solar LCOE R0.75/kWh vs Eskom R2.20/kWh → saving R1.45/kWh
- Year 5: Solar LCOE R0.75/kWh vs Eskom R3.22/kWh (10% p.a.) → saving R2.47/kWh
- Year 10: Solar LCOE R0.75/kWh vs Eskom R5.18/kWh → saving R4.43/kWh
- Year 20: Solar LCOE R0.75/kWh vs Eskom R13.44/kWh → saving R12.69/kWh
The solar system installed today becomes progressively more valuable every year as Eskom tariffs rise. A system with a 5-year payback period at today's tariff has an effective negative-cost from year 6 onwards — you are saving more in absolute rands each year as prices escalate, while your capital cost is already recovered.
The Section 12B Deduction Changes the Calculus Further
The South African government recognised solar as a strategic investment for energy security. Section 12B of the Income Tax Act was amended in 2023 to allow a 125% deduction of solar generation asset costs in the first year for businesses meeting the qualifying criteria.
This means a qualifying solar installation costs approximately 28% less in real after-tax terms (at a 28% corporate tax rate) than the quoted price. A R2 million solar system effectively costs R1.44 million after the Section 12B benefit.
Combined with the electricity tariff hedge, the investment case for commercial solar is among the most compelling available to South African businesses today. This is why South African corporate finance teams — who previously treated solar as a facilities decision — are now including it in capital allocation analysis.
Municipal Tariff Increases vs Eskom Direct
For businesses supplied by a municipality (which is the majority in urban South Africa), it is important to note that municipalities apply their own tariff structures on top of Eskom's bulk tariff. Municipalities add a margin — often 20–40% above Eskom bulk — to fund local infrastructure and cross-subsidise residential consumers.
This means urban commercial consumers typically pay more per kWh than Eskom direct consumers, and their tariff increases compound from a higher base. City of Johannesburg, Cape Town, Tshwane, and eThekwini all implement annual tariff adjustments typically at or above Eskom's approved increase rate.
Some municipalities have additionally introduced time-of-use (TOU) tariff structures, charging peak rates (typically 17:00–21:00 weekdays) that are 2–4× the off-peak rate. For businesses operating into the evening, these TOU rates dramatically increase the value of battery storage that can discharge during peak tariff hours.
Practical Implications for Business Planning
Given the tariff trajectory, South African businesses should build the following into their energy and capital planning:
- Model electricity as a growing cost: Use 10–12% annual escalation in any business model, investment case, or property valuation that includes electricity as a material input cost.
- Treat solar as a hedge, not just a cost saving: The value of solar is not just what it saves today — it is the volatility it eliminates from your cost base for 25 years.
- Size solar to self-consumption: The maximum value comes from solar energy consumed directly. Energy exported to the grid (if no feed-in tariff applies) has zero immediate financial value. Size the system to meet your daytime consumption profile.
- Consider time-of-use tariffs: If your municipality has or is implementing TOU tariffs, battery storage that dispatches during peak hours adds significant value and should be included in the system design.
- Act sooner rather than later: Every month of delay is a month of paying escalating Eskom tariffs while solar panel costs (which have declined 90% since 2012 and are now relatively stable) are near historic lows.
Conclusion
The Eskom tariff increase history is not just an interesting economic fact — it is the foundational argument for commercial solar in South Africa. No other business investment reliably reduces its effective payback period every year automatically as its competition (the grid tariff) increases.
A solar system installed in 2026 locks in energy generation at today's cost for 25 years. Every tariff increase Eskom and your municipality impose after installation date does not affect your solar-generated kilowatt-hours. It only increases the value of those kilowatt-hours.
Given Eskom's structural financial position and South Africa's energy infrastructure requirements, the probability of tariffs stabilising at current levels is extremely low. The probability of continued above-CPI increases is very high. Solar — with its fixed capital cost and 25-year production life — is one of the most rational responses available to South African businesses today.